I build analytics for a living, so believe me when I say this as confession rather than criticism: the restaurant industry does not have a data problem. It has a translation problem. Your POS produces immaculate tables — item sales, ticket sizes, voids, hourly buckets. What it never produces is the sentence you actually need: 'Dinner revenue dipped because the two top mains underperformed Tuesday and Wednesday, table turns were normal, and here's the one thing worth changing before the weekend.'
That sentence is analysis, and analysis has historically required either an analyst on payroll or an owner with a spreadsheet habit and a free Sunday. Dash — Nuxa's operations and reporting employee — exists to write that sentence every day. Here's how the narration works, and why we built it to be checkable rather than just fluent.
Why isn't a sales chart enough?
A chart shows what happened; a decision needs why, how much it matters, and what to do. Those are three translation steps — anomaly detection, significance against your own baselines, and recommendation — and every one of them is currently done in the owner's head, usually at 11pm. A 6% revenue dip might be weather, a holiday shift, one 86'd bestseller, or the start of a real trend. The chart looks identical in all four cases. The right response is different in all four.
How does Dash turn POS tables into a narrative?
Three steps, each one inspectable:
- Baseline: every metric is compared to your restaurant's own history for that weekday, daypart, and season — not an industry average. 'Down 6%' only becomes a story once Dash knows your Tuesdays.
- Decompose: the dip gets broken into parts — covers vs. ticket size, dine-in vs. delivery, which items moved. The narration names the actual driver: 'the dip is two mains, not fewer guests.'
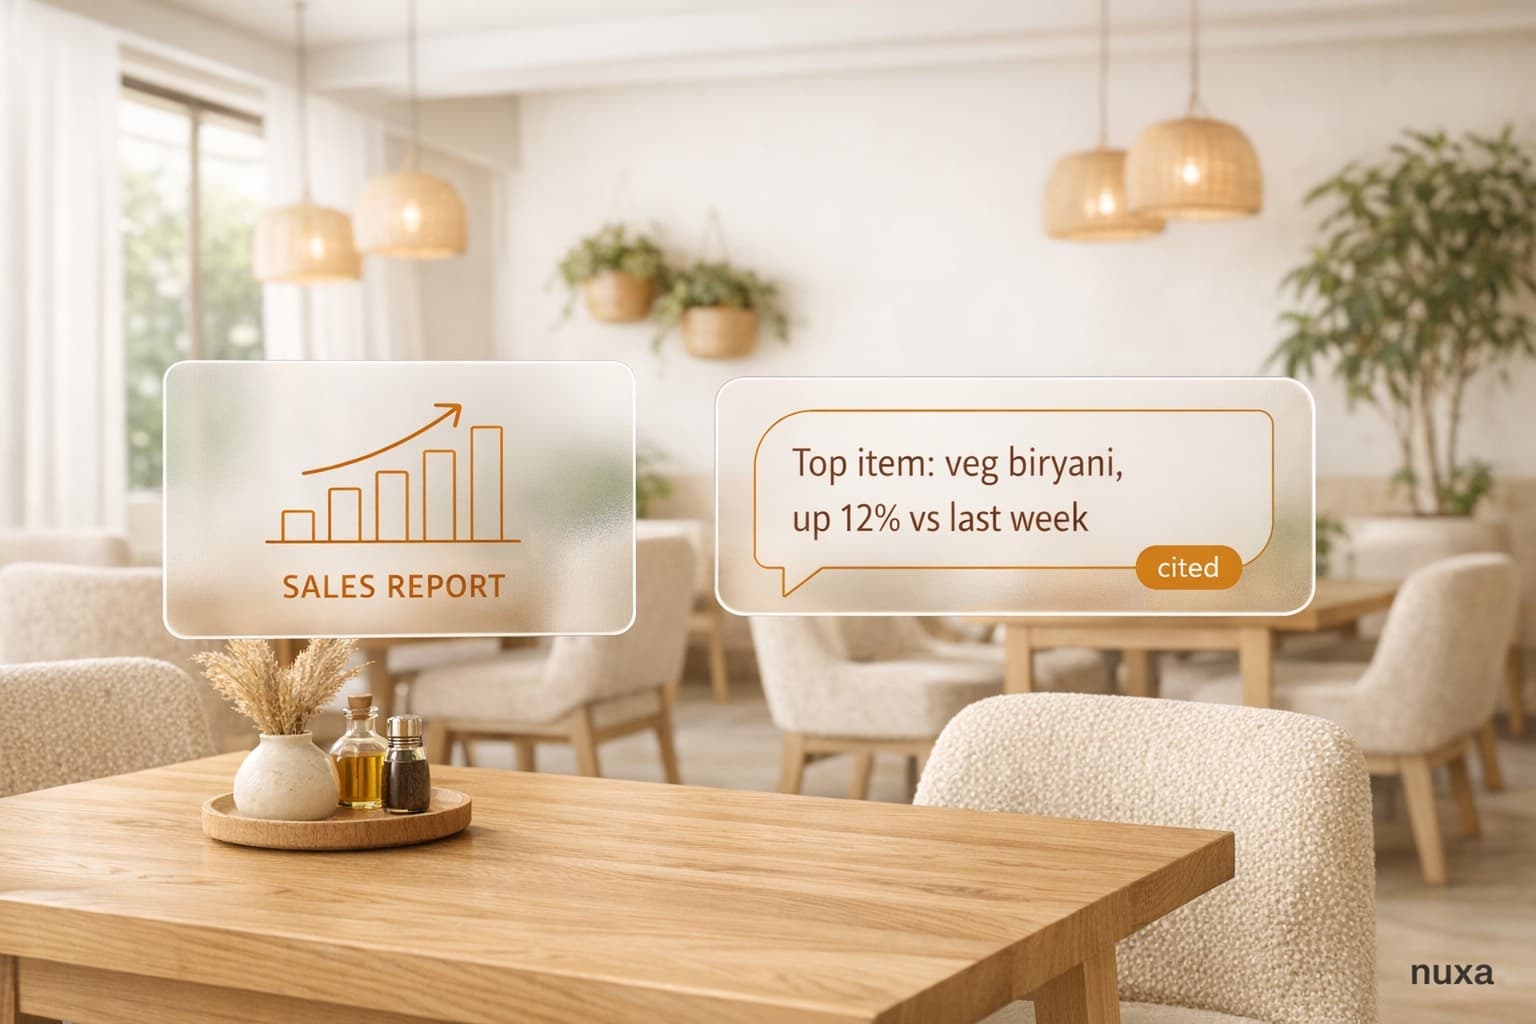
- Narrate and rank: findings come out as short plain-language paragraphs, ordered by how much money each one represents, each ending in something doable — watch it, change it, or ignore it.
The output reads like a sharp manager's morning note, not a model's musings: 'Schnitzel sales fell 22% on the two nights Anna wasn't on the pass — worth a look at plating times' beats any chart you'd have assembled yourself, and it arrives in the brief at nuxa.ai/daily-brief before you've found your keys.
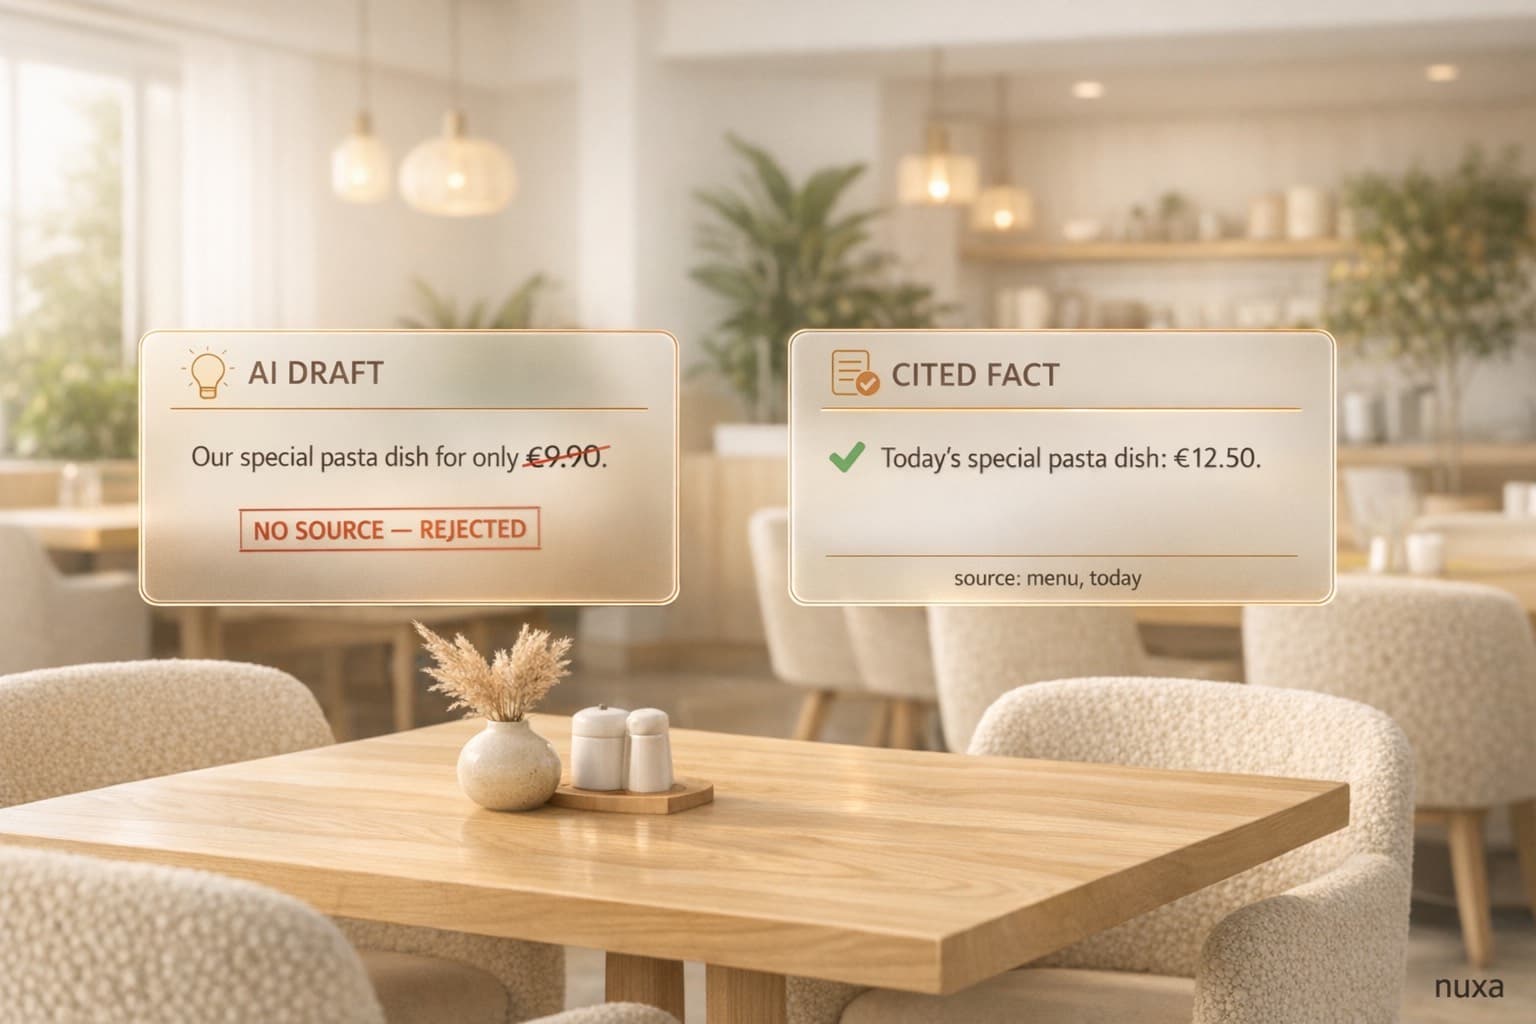
How do I know the narration isn't making things up?
This is the question that should disqualify most 'AI insights' features, because a fluent wrong explanation is more dangerous than a raw table — you'll act on it. Dash runs under the same cite-or-die guardrail as every Nuxa employee: each number and each claimed driver in the narration must cite the claims behind it, down to the order rows. A sentence that can't cite is rejected before the report assembles. The citation chips sit under every paragraph; tap one and you're looking at the underlying data. Fluency is cheap now. Receipts are the product. (The full guardrail model is at nuxa.ai/trust.)
The worst analyst isn't the one who says 'I don't know.' It's the one who's confidently wrong in good prose. We built Dash so the second kind can't exist: no citation, no sentence.
Does narration replace reports for my accountant or partners?
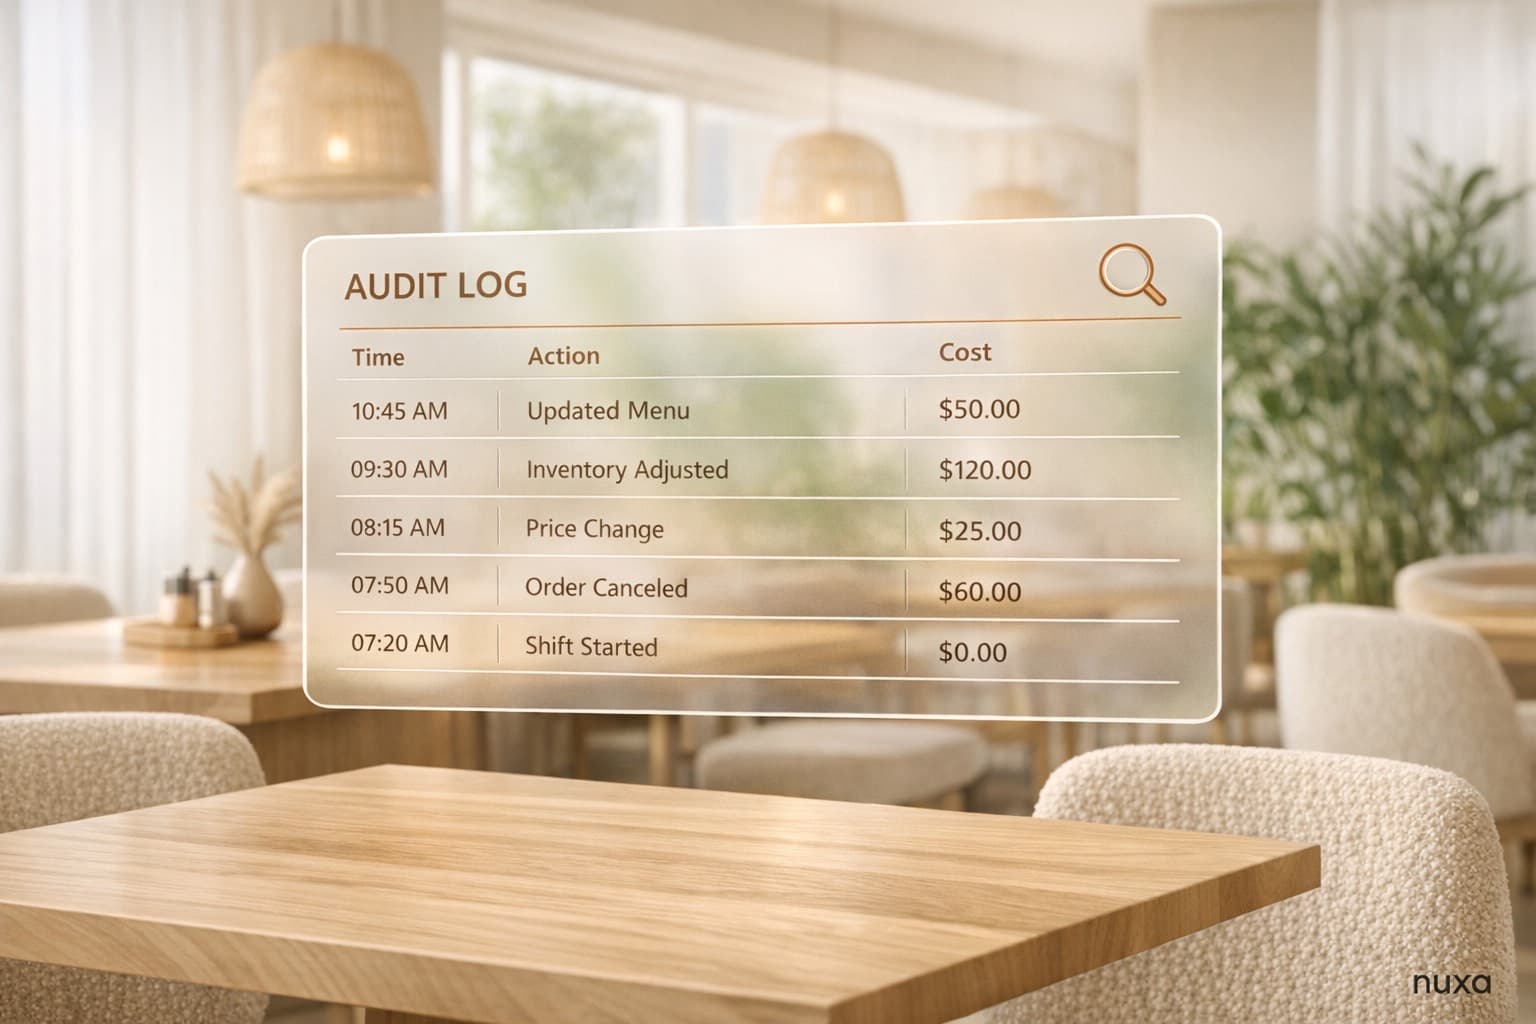
It sits on top of them, and that layering is deliberate. The tables remain the record — exportable, reconcilable, boring in the best way — and every Dash narration links back to them. What changes is who does the reading. Your accountant gets numbers that arrive pre-explained, with an audit log showing every action and model call behind them, metered and capped. Your business partner gets the weekly story in three paragraphs instead of a screenshot of a dashboard. And anything Dash proposes doing about the numbers — not just describing them — waits at the approval line like everything else public, financial, or irreversible.
What decisions actually get better?
The small weekly ones, which is where restaurant margins actually live. Menu calls: which underperformer to cut, which quiet star to promote, made monthly on evidence instead of annually on instinct. Staffing: matching Thursday's pattern instead of last year's habit. Promo timing: pushing the dish that's trending up, not the one you happen to love. None of these is a dramatic pivot; all of them compound. Owners who decide from a narrated, cited report every morning just make more correct small calls per month than owners who decide from memory and a sales total.
Plain language was never about dumbing the data down. It's about finishing the analysis instead of outsourcing the last, hardest step to a tired owner at midnight. Dash ships in both plans at nuxa.ai/pricing — and if you want to see your own numbers narrated before you commit, the morning brief is where it starts.